Static METAR Plots
These are a set of static plots generated by ADDS showing a composite station model plot (see Station Format below) for a set of stations in a particular region. There are 19 regions plus a CONUS view. Each plot is updated every 5 minutes. The web page we refresh every 15 minutes.
Station Model Format
The station model plot is a standardized way of showing muliple pieces of data at a partcular site. Some of the data are coded and others are shown as symbols. Fig. 1 shows the layout of data. The parameters are:
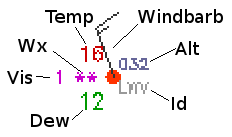
- Temp - Temperature plotted in the upper left in Fahrenheit
- Windbarb - The wind barb. The stick points in the direction the winds are coming from. Each full barb represents 10 knots of wind. Each half barb represents 5 knots. In this case, you have winds from the NNW at 15 knots. If there are wind gusts, the number will be displayed at the end of the barb as G23 or gusts to 23 knots.
- Alt - Last three digits of the altimeter setting plotted upper right in inches Hg. In this case, 032 represents 30.32 inches Hg.
- Id - The last 3 letters of the ICAO identifier for the site. LWV is Lawrenceville IL.
- Dew - The dewpoint temperature plotted in the lower left in F.
- Vis - The visibility plotted to the left of the weather symbol, in statute miles.
- Wx - A symbol representing present weather plotted just to the left of the cloud cover symbol.
- Cover - The cloud cover symbol is plotted in the center. The amount the circle is filled represents the amount of cloud cover. In this case, it's
overcast. The color of the circle represents the flight conditions:
- green - VFR (Visual Flight Rules)
- blue - MVFR (Marginal Visual Flight Rules)
- red - IFR (Instrument Flight Rules)
- purple - LIFR (Low Instrument Flight Rules)
Wind barbs
The wind barbs types are shown in Fig. 2. Calm winds are shown as a concentric around the station location. Long barbs are 10 knots. Short barbs are 5 knots. A flag represents 50 knots. Five knots is a short barb offset from the end. The barb always points in the direction the winds are coming from.

Flight category definitions
| Category | Color | Ceiling | Visibility | |
|---|---|---|---|---|
| LIFR Low Instrument Flight Rules |
Magenta | below 500 feet AGL | and-or | less than 1 mile |
| IFR Instrument Flight Rules | Red | 500 to below 1,000 feet AGL | and/or | 1 mile to less than 3 miles |
| MVFR Marginal Visual Flight Rules | Blue | 1,000 to 3,000 feet AGL | and/or | 3 to 5 miles |
| VFR Visual Flight Rules | Green | greater than 3,000 feet AGL | and | greater than 5 miles |
| NOTES: By definition, IFR is ceiling less than 1,000 feet AGL and/or visibility less than 3 miles while LIFR is a sub-category of IFR. By definition, VFR is ceiling greater than or equal to 3,000 feet AGL and visibility greater than or equal to 5 miles while MVFR is a sub-category of VFR. |
||||
Cloud coverage symbols
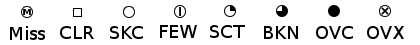
Automated stations report "CLR" when clouds may exist above 12,000 feet so a square is used to represent this uncertainty whereas an unfilled circle is used for "SKC" which a human reports the sky is completely clear overhead. The abbreviation "OVX" is unofficial but ADDS uses it here to indicate the sky is obscured which is the case when a METAR reports vertical visibility and no cloud information.
Present Weather symbols
Plots of station data may include one of the following symbols to represent the present weather. METARs may include more than one type of weather condition but only one icon ever gets plotted. Two additional documents show the original descriptions abridged from the World Meteorological Organization (WMO) and which symbol is plotted for each present weather text string. These are not necessarily official but they represent our best matching of weather conditions to the original WMO table of icons.
Original WMO table and abridged descriptions of symbols: wxSymbols_anno1.pdf (291 KB).
Text string for present weather found in METARs mapped to icons and plotting priority order: wxSymbols_anno2.pdf (313 KB).
URL Options
Here is a list of the URL options:
- region=region - This selects the specific region to display. The regions are:
- us - CONUS US
- alb - Albany NY
- bwi - Baltimore MD
- clt - Charlotte NC
- tpa - Tampa FL
- dtw - Detroit MI
- evv - Evansville IN
- mgm - Montgomery AL
- msp - Minneapolis MN
- lit - Little Rock AR
- pir - Pierre SD
- ict - Wichita KS
- aus - Austin TX
- cod - Cody WY
- den - Denver CO
- abq - Albuquerque NM
- lws - Lewiston ID
- wmc - Winnemuca NV
- las - Las Vegas NV
- pak - Alaska
- date=yyyymmddhhnn - This selects a specific date and time to display. ADDS creates images every 5 minutes. The default is current.