Interactive Display
The METARs page displays current surface observations. This page uses OpenLayers to provide an interactive display of data including zoom and pan and each observation can be clicked on to get more information.
Parameter Output
Here is a list of the parameters that can be displayed:
- station model - This is a standard station model with temperature in the upper left, dewpoint in the lower left, coded altimeter setting in upper right, visibility far left, weather near left, cloud cover colored by flight category and wind barb.
- temperature - The is temperature in F. C if metric selected
- dewpoint - The dewpoint in F. C if metric selected
- relative humidity - The relative humidity in %
- altimeter - The coded altimeter setting. This is the last three digits of the setting in 0.01 inches Hg. For example 993 is 29.92 in. Hg.If metric selected, its the last three digits of the setting in 0.1 hPa. For example 112 is 1011.2 hPa (or millibars)
- visibility - The visibility in whole miles. km if metric selected
- ceiling - The cloud ceiling in 100s of ft (BKN, OVC, OVX only)
- cloud cover - A cloud coverage symbol
- winds - Wind barbs with full barb at 10 knots
- wind speed - The speed in knots
- wind gust - The wind gusts in knots
- flight cat - Colored circles representing flight category: green = VFR, blue = MVFR, red = IFR, magenta = LIFR
- weather - Weather symbol representing current weather
Each of the parameters can be displayed separately or a subset of the station model can be dislayed by selecting multiple parameters. If only the ceiling, visibility and cloud cover are needed, select those from the data selector and they'll show up in the proper position in the station model.
When the site is clicked, a dialog box appears with the latest raw METAR data displayed. If the decoded option is set, decoded data will display in place of the METAR. If the taf option is set, the latest TAF will be appended to the end of the data.
The data density setting changes the priority level of data to display. Selecting “-1” will reduce the number of stations plotted. A “+1” will roughly double the number. A “+2” will double again the number of plotted stations. Select the density appropriate to the needed plot.
Station Model Plot
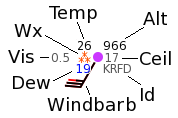
In many cases, the data are plotted using standard symbols and plotting models. Fig. 1 shows the station model used in the METAR and TAF plots.
- Temp - Temperature plotted in the upper left in F (C for metric setting)
- Alt - Last three digits of the altimeter setting plotted upper right in inches Hg (hPa for metric). In this case, 966 represents 29.66 inches Hg.
- Ceil - Ceiling height in hundreds of feet. This represents the height of the lowest broken or overcast cloud layer.
- Id - The 4 letter ICAO identifier for the site. KRFD is Rockford, IL.
- Windbarb - The wind barb. The stick points in the direction the winds are coming from. Each full barb represents 10 knots of wind. Each half barb represents 5 knots. Red represents wind gusts. In this case, you have winds from the SSE at 25 knots with gusts to 30 knots.

Figure 2: Wind barbs - Dew - The dewpoint temperature plotted in the lower left in F (C for metric setting).
- Vis - The visibility plotted to the left of the weather symbol, in statute miles (km for metric).
- Wx - A symbol representing present weather plotted just to the left of the cloud cover symbol.
- Cover - The cloud cover symbol is plotted in the center. The amount the circle is filled represents the amount of cloud cover. In this case, it's overcast. The color of the circle represents the flight conditions:
- green - VFR (Visual Flight Rules)
- blue - MVFR (Marginal Visual Flight Rules)
- red - IFR (Instrument Flight Rules)
- purple - LIFR (Low Instrument Flight Rules)
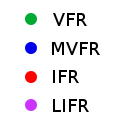
Figure 3: Flight category icon color
URL Options
Here is a list of the URL options:
- date=yyyymmddhhnn - This selects a specific date and time to display. The ADDS database stores roughly a weeks worth of METAR data. Selecting a specific date will display METARs valid for that time.
- center=lat,lon - This will center the map at a specific latitude and longitude. The default is 39,-97.
- zoom=level - This sets the zoom level. The default is 4. A higher number zooms in. A lower number zooms out.
- basemap={light|dark|simple} - This selects the type of basemap. The default is light.
- sat={on|off} - This turns the satellite layer on or off. The default is on.
- radar={on|off} - This turns the radar layer on or off. The default is on.
- plottype=param - This selects the display parameter. The default is model. Multiple parameters can be selected separated by commas. Options are:
- model - station model
- temp - temperature
- dew - dewpoint
- rhum - relative humidity
- alt - altimeter setting
- vis - visibility
- ceil - cloud ceiling
- cover - cloud cover
- wind - wind barb
- wspd - wind speed
- wgst - wind gust
- cat - flight category
- wx - weather symbol
- density={-1|0|+1|+2} - The data density. The greater the number the more stations will plot. The default is 0.
- metric={on|off} - Specifies to display data in metric units. The default is off.
- decoded={on|off} - Specifies to show decoded data in popup dialog box. The default is off.
- taf={on|off} - Specifies to add TAF to popup dialog box. The default is off.
- counties={on|off} - Turns county layer on or off. The default is off.
- highways={on|off} - Turns highway layer on or off. These are primarily interstates. The default is off.
- roads={on|off} - Turns roads layer on or off. These are primarily US and state highways plus some city streets. The default is off.
- jetroutes={on|off} - Turns the top jetroutes layer on or off. The default is off.
- firs={on|off} - Turns the FIR layer on or off. The default is off.
- hover={on|off} - Turns on hover for features. The popups will come up when mouse hovers. Default is off.