Traffic Flow Management (TFM) Convective Forecast (TCF)
Training:
A Traffic Flow Management (TFM) Convective Forecast (TCF) training package may be found at https://tfmlearning.faa.gov/.
Product Description:
The TCF is a high confidence graphical representation of forecasted convection meeting specific criteria of coverage, intensity, and echo top height. The TCF graphics are produced every 2 hours and valid at 4-, 6-, and 8- hours after issuance time.
Areas of convection in the TCF include any area of convective cells containing (at a minimum):
- Composite radar reflectivity of at least 40 dBZ;
- Echo tops at or above FL250;
- Coverage (a & b) of at least 25% of the polygon area;
- Forecaster confidence of at least 50% (High) that criteria (a, b, & c) will be met.
Lines of convection in the TCF include any lines of convective cells:
- Composite radar reflectivity of at least 40 dBZ having a length of at least 100 nautical miles (NM); and
- Having a linear coverage of 75% or greater; and
- Having echo tops at or above FL250.
- Forecaster confidence of at least 50% (High) that criteria (a, b, & c) will be met.
All four of the threshold criteria listed above for both areas and lines of convection are required for inclusion in the TCF. This is defined as the minimum TCF criteria.
The TCF domain is the Flight Information Regions (FIR) covering the 48 contiguous states and adjacent coastal waters. It also includes the Canadian airspace south of a line from Thunder Bay, Ontario to Quebec City, Quebec.
Availability:
From March 1 through October 31 the TCF is collaboratively produced by meteorologists at the Aviation Weather Center (AWC) in Kansas City, Missouri and embedded at the Federal Aviation Administration (FAA) Air Traffic Control System Command Center (ATCSCC) in Warrenton, Virginia; at the Center Weather Service Units (CWSU) embedded at the FAA’s Air Route Traffic Control Center (ARTCC); at various airlines; and by other authorized participants. Automated routines will continue to make the TCF available from November through February. Lines of convection are not depicted when automated routines produce the TCF.
The TCF is issued 24 hours a day seven days a week at 30 minutes prior to the indicated issuance time. The issuance time supports the FAA’s Strategic Planning (SP) Webinar which occur 15 minutes following odd hours Eastern Time. The Canadian portion of the forecast is available from April 1st through September 30th. However, Nav Canada may request the issuance of each forecast as early as March 1st and as late as October 31st. All available Canadian forecasts are incorporated into the TCF. During times the forecasts are not available for Canadian airspace, the TCF graphics will be annotated with “No Canadian TCF.”
Purpose/Intended Use:
Government and airline industry Air Traffic Management (ATM) decision makers need timely delivery of high-confidence, high-relevance forecasts of convection across the Continental United States and adjacent coastal waters. These forecasts will allow ATM decision makers to proactively and collaboratively initiate, amend, or terminate planned or active Traffic Flow Management initiatives, resulting in safe and efficient use of the National Airspace System (NAS).
Specifically, the TCF requirements are designed to address three major purposes:
- Intended to provide an accurate representation of the convection of most significance for strategic decisions of air traffic flow management;
- Intended to provide a common forecast baseline, as consistent as possible, shared and collaborated among all meteorological organizations responsible for providing forecasts of convection to Air Traffic Management (ATM) within the FAA/Industry Collaborative Decision Making (CDM) processes and/or within commercial aviation organizations; and
- Intended for use as the authoritative source of convective weather forecast information for Traffic Flow Management strategic planning and decisions which are collaborated between the government and industry.
Audience/Users:
The TCF is used by air traffic management decision-makers in support of convective weather mitigation strategies within the NAS. It is designed to meet the needs of TFM decision makers at the Federal Aviation Administration’s (FAA) Air Traffic Control System Command Center (ATCSCC), FAA Air Route Traffic Control Center (ARTCC) Traffic Management Units (TMU), and airline and corporate Flight Operations Centers (FOC).
Verification:
The Earth Systems Research Laboratory’s (ESRL) Global Systems Division Convective Weather Verification Service prototype: https://esrl.noaa.gov/fiqas/tech/convective/monitor/.
Format:
The TCF is available in graphical format https://www.aviationweather.gov/tcf and via ASCII coded text via NOAAPort. The ASCII files are issued under the following WMO Headers:
- FAUS28 KKCI – 4 Hour Forecast
- FAUS29 KKCI – 6 Hour Forecast
- FAUS30 KKCI – 8 Hour Forecast
The graphics available at https://www.aviationweather.gov/tcf have the following format:
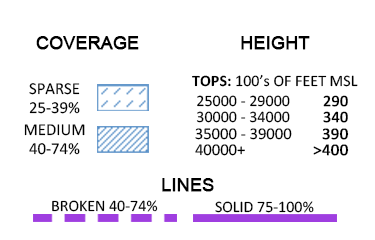
Areas of convection are identified by blue polygons or solid purple lines in the TCF forecasts. Coverage is indicated by broken hatching (25-39%) and striped hatching (40-74%). Within each TCF polygon, maximum echo tops encompassing coverage greater than 25% are identified in one of four classes:
- 25,000 - 29,000 feet MSL are identified as 290
- 30,000 - 34,000 feet MSL are identified as 340
- 35,000 - 39,000 feet MSL are identified as 390
- 40,000 feet MSL and above are identified as >400
The echo tops classification is incorporated inside the polygon. If the shape or size of the polygon does not allow for inclusion of this data inside the polygon, a line will be drawn in a convenient location extending from the interior of the polygon to the label.
A line of convection containing high coverage (75-100%) is displayed as a solid purple line, meaning a solid line of forecast convection alone, or within an area (polygon) of coverage.
The TCF ASCII formatted data fields are described below:
General Format
    CCFP ISSUED VALID
    AREA COVERAGE CONFIDENCE GROWTH TOPS SPEED DIRECTION VERT# LAT[1]
    LON[1] .... LAT[VERT#] LON[VERT#] LATT LONT
    LINE COVERAGE VERT# LAT[1] LON[1] .... LAT[VERT#] LON[VERT#]
    CANADA_FLAG {ON/OFF}
Forecast Header Format
    CCFP     TCF Header                     4 Characters
    ISSUED   Forecast Issuance Time (UTC)   CCYYMMDD_hhmm
    VALID    Forecast Valid Time (UTC)      CCYYMMDD_hhmm
Forecast Area Format
    AREA             Convective Area        4 Characters

    AREAL COVERAGE   Convective Coverage    1 Digit Integer Code
       Medium        = 2  40-74%
       Sparse        = 3  25-39%

    CONFIDENCE       Confidence             1 Digit Integer Code
         High        = 1  50-100%

    GROWTH           Not Used in TCF        1 Digit Integer Code
                     = 3  (Convective Growth Code is not used)

    TOPS             Storm Height           1 Digit Integer Code
       FL400         = 1
       FL350-FL390   = 2
       FL300-FL340   = 3
       FL250-FL290   = 4

    SPEED            Not Used in TCF        Integer
       Speed         = 0

    DIRECTION        Not Used in TCF        Integer
       Direction     = 0

    VERT#            Number of LAT/LON Pairs         Integer

    LAT[x]LON[x]     Vertex Latitude and Longitude   Integer Pair
       Latitude      = LAT * 10.0 degrees
       Longitude     = LON * -1 * 10.0 degrees

    LATT LONT        Longitude and Latitude of Left Center of Box
       Latitude      = LATT * 10.0 degrees
       Longitude     = LONT * - 1 * 10.0 degrees
Forecast Line Format
    LINE             Convective Line        4 Characters

    LINE COVERAGE    Convective Coverage    1 Digit Integer Code
       Solid         = 1  75-100%

    VERT#            Number of LAT/LON Pairs         Integer

    LAT[x]LON[x]     Vertex Latitude and Longitude   Integer Pair
       Latitude      = LAT * 10.0 degrees
       Longitude     = LON * -1 * 10.0 degrees
Canadian Participation Format
    CANADA_FLAG
       CANADA OFF
       CANADA ON